Chicken, coffee and house prices
My friend does comedy gigs
A friend does comedy, and thinks you can find out about house prices using chicken and coffee.
Skills employed: Open data analysis, Google Maps API, Python (numpy, scipy, matplotlib), data visualisation, project design, Linux
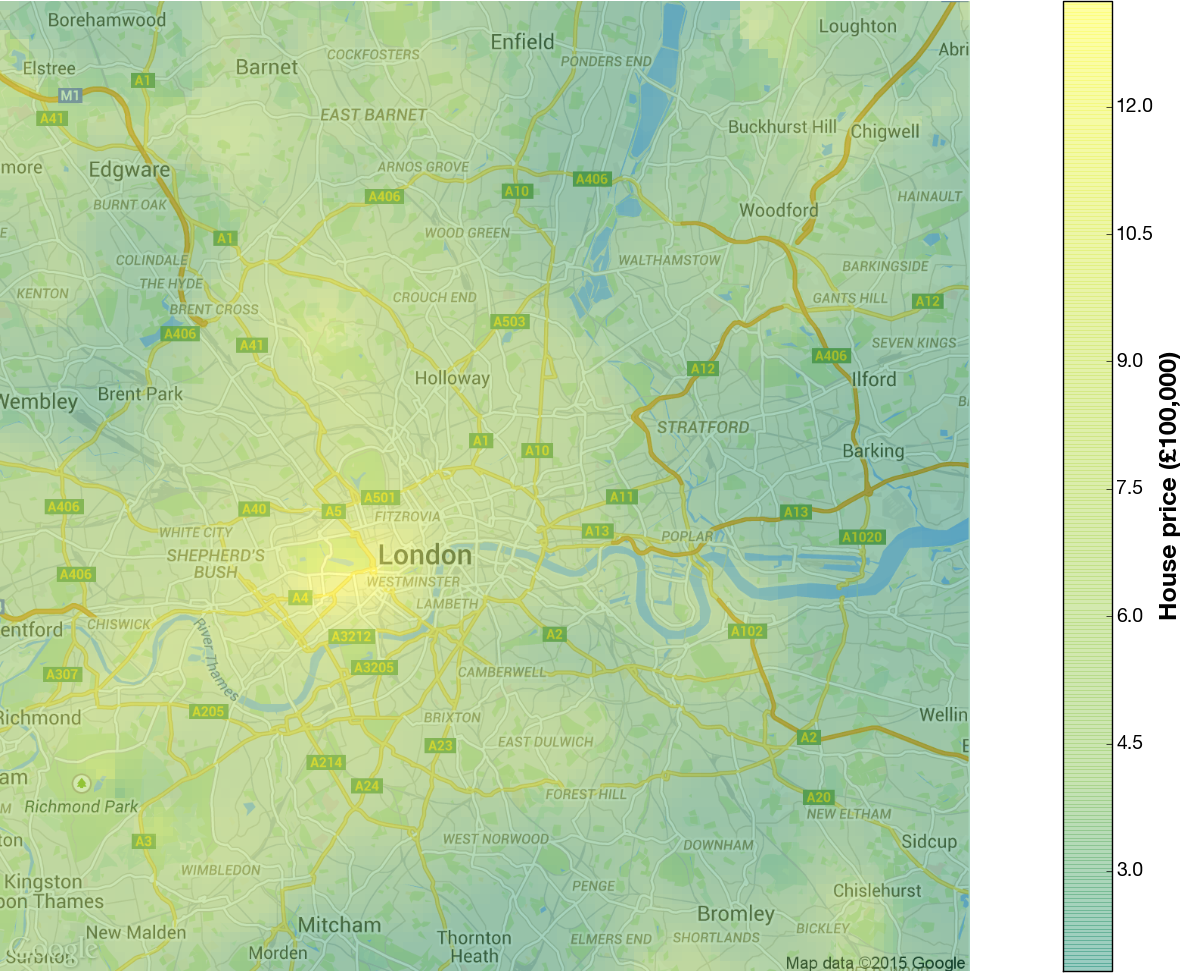
2014 median house prices across London, moving window.
Data vis for comedy
Sam, a friend of mine, does comedy gigs. One of his bits is about predicting house prices using chicken and coffee, the hypothesis being that chicken shops are more prevalent in less well off areas, coffee shops more prevalent in better off areas. So, you can gauge which areas are up and coming by comparing the prevalence of chicken and coffee.
I set the data gathering, cleaning and visualisation as a project in a training course a friend runs, and me and one of the students worked on it. We got the chicken and coffee shop locations using the google maps API, I got the house price data from the Land Registry, and we plotted it all up.
Here's Sam's write up. It's quite good. He's seeing if he can get it in some papers.
We also did some statistical analysis. It really isn't very predictive at all, unfortunately.